
From Return on Investment to Return on Environment: Investing in a Sustainable Planet
From Return on Investment to Return on Environment: Investing in a Sustainable Planet
October 2026, by Jindra Čekan/ová1 & Margaret A Spearman2
Reposted from International Journal of Social Science Studies 4(4):1 URL: https://doi.org/10.11114/ijsss.v14i4.
Abstract
This desk-review article examines the ecological damage and lost investment opportunities associated with the prevailing economic paradigm. It proposes Return on Environment (RoEn) as a complement to Return on Investment (ROI) for evaluating and encouraging regenerative, nature-positive investment. The global economy has transgressed seven of nine planetary boundaries, while more than half of global gross domestic product depends moderately or highly on nature. Yet environmental, social, and governance (ESG) and impact-investing frameworks often define “impact” by how funds are spent rather than by verified changes in ecosystems. Drawing on ecological economics, natural capital accounting, the practice of monitoring, reporting, and verification (MRV), and selected nature-finance cases, the article makes three contributions. First, it defines RoEn across six preliminary dimensions: carbon, water, biodiversity, resilience, natural capital, and community. Second, it presents a five-level Environmental Impact Continuum—destructive, harmful, neutral, beneficial, and regenerative—and illustrates each level with investment examples. Third, it proposes a scoring rubric that rates investments across the six dimensions, discounts unverified gains, and combines a monetized RoEn ratio with a non-monetized score for reporting alongside ROI. The article concludes that nature is economic infrastructure; impact should require measurable environmental outcomes verified independently and by communities; and investment horizons should extend across multi-decade ecological and financial cycles while centering communities most exposed to ecological breakdown. The tools required for large-scale ecological regeneration already exist.
Keywords: Return on Environment, Return on Investment, environmental impact continuum, impact investing, impact measurement, natural capital, ecosystem services, sustainable finance
1. Introduction
1.1 Nature as Economic Infrastructure and a Source of Financial Risk
This article begins from a simple premise: regenerating nature strengthens collective well-being, reduces costs, protects lives, and creates durable economic returns. More than half of global gross domestic product (GDP)—at least $44 trillion to $58 trillion—is moderately or highly dependent on nature. Construction ($4 trillion), agriculture ($2.5 trillion), and food and beverages ($1.4 trillion) are among the most exposed sectors (World Economic Forum [WEF], 2020; World Wide Fund for Nature [WWF], 2024). This value is also geographically concentrated: roughly 40% of the world’s population lives within 100 km of the coast, on about 5% of inhabited land that generates 30% to 50% of global GDP (WEF, 2026). Despite this dependence, every $1 spent protecting nature is outweighed by $30 spent destroying it (United Nations Environment Programme [UNEP], 2026). Unless otherwise stated, all monetary values in this article are in US dollars.
This concentration of economic value is also a vulnerability. When mangroves are cleared along the Vietnamese coastline, storm-surge damage to coastal farms and factories rises; when prairie grass is plowed in Illinois and topsoil is lost, flood-insurance payouts rise. An economy built on extraction alone increases investment risk while reducing the certainty of livelihoods and returns. Ignoring ecological degradation is therefore a profound failure of risk management; and without a change in investment priorities, the costs of extreme events, water scarcity, biodiversity collapse, and insurance volatility will keep rising (WEF, 2024). These costs are unevenly borne. Natural disasters in 2021 cost the German insurance industry €12.5 billion (Evans, 2021) and floods killed 220 people across Germany and neighboring countries (Agence France-Presse & Associated Press, 2022). In contrast, record floods in Nigeria, Cameroon, Niger, and Chad in 2022 and 2024 caused over 2500 deaths, displaced 4 million people, kept 10 million children out of school, and inundated millions of hectares of farmland, with no insurers to cover the losses (Africa Center for Strategic Studies, 2024). The contrast reflects a stark disparity in risk planning and response capacity (Khalfan et al., 2023). In 2025, climate-worsened disasters caused $220 billion to $224 billion in global economic losses, of which only about $107 billion to $108 billion was insured (Evans, 2026). These losses were not inevitable.
1.2 Crossed Planetary Boundaries and the Ecological Deficit
The pressure that economic demand places on natural systems is visible in the distribution of mammalian life on Earth (Figure 1). Wild terrestrial mammals have declined by 85% since humans emerged some 100 000 years ago (Ritchie, 2021) and monitored wildlife populations fell by 73% between 1970 and 2020 alone (WWF, 2024). Measured in biomass from an 1850 baseline, humans and their livestock have expanded so rapidly that they now make up 95% of all mammalian biomass, while all wild terrestrial and marine mammals together account for only 5%.
Figure 1. Global mammalian biomass
These pressures cascade. The planetary boundaries framework maps nine Earth-system processes that underpin life, from climate and biosphere integrity to freshwater, land systems, and novel entities such as microplastics, which were assessed for the first time in 2023 (Richardson et al., 2023). The number of boundaries assessed and crossed has doubled since 2009; three more were crossed between 2015 and 2025 (Figure 2), bringing the total to seven of nine, with ocean acidification identified as the seventh in 2025 (Potsdam Institute for Climate Impact Research, 2025). The ocean, which covers 70% of the planet’s surface, has become 30% to 40% more acidic since the start of the industrial era, impairing the ability of plankton, mollusks, and corals at the base of the marine food web to form calcium carbonate (National Oceanic and Atmospheric Administration, 2025).
Figure 2. Planetary boundaries crossed, 2015 and 2025

Biosphere integrity is another breached boundary, and biodiversity is the building block of functioning ecosystems (Center for Biological Diversity, n.d.). The Red List of the International Union for Conservation of Nature (IUCN) names 172 600 assessed species, more than 48 600 of which are threatened with extinction, including a large share of corals, amphibians, conifers, sharks and rays, mammals, freshwater fish, and birds (IUCN Red List of Threatened Species, n.d.). Nature-based solutions (NbS) link biodiversity to the investments needed for planetary health. IUCN defines NbS as actions to protect, sustainably manage, and restore ecosystems in ways that address societal challenges such as climate change, disasters, and food and water security while benefiting biodiversity and human well-being, and it provides a Global Standard for designing, verifying, and scaling them (International Union for Conservation of Nature [IUCN], 2020). The Taskforce on Nature-related Financial Disclosures (TNFD) estimates that investment in NbS must rise to $674 billion by 2050 to halt biodiversity loss, limit warming to 1.5 °C, and achieve land degradation neutrality (TNFD, n.d.-b).
In short, humanity is running a profound ecological deficit, and every crossed boundary is also an opportunity to regenerate the Earth’s environmental integrity. Since the 1970s, humanity has been in ecological overshoot, extracting resources and generating waste faster than the Earth can regenerate and absorb them (Global Footprint Network, 2025). Natural systems now operate at a fraction of their productive capacity and must be regenerated before the “free” goods and services they provide, such as clean air, water, and fertile soil, become replaceable only at insurmountable cost (WWF, 2024). Engineered substitutes such as mechanical filtration, built coastal defenses, and mechanical pollination cannot approximate living systems that have co-evolved over millions of years. Nature is not an externality; the true cost of the human ecological footprint is displaced onto ecosystems that are less and less able to function and deferred to future generations.
1.3 The Costs of Inaction and the Investment Opportunity
The financial costs of inaction are becoming quantifiable. Applying S&P Global’s sovereign credit rating methodology to biodiversity scenarios, Agarwala et al. (2026) modeled a worst case for 23 countries that are home to 5.5 billion people: a 90% drop in wild pollination, a 90% drop in marine fish catch, and the loss of 88% of tropical forest. Such a collapse would reduce global GDP by $2 trillion by 2030 and add $162 billion in annual interest payments across those countries, equal to 81% of the $200 billion annual target for investing in nature under the Global Biodiversity Framework. Agarwala et al. estimated that markets are mispricing and misallocating $83 trillion of financial assets, and biodiversity loss is beginning to be factored into national creditworthiness.
Fossil fuel investments face imminent losses as stranded assets. Driven by carbon pricing, a shift in demand toward cheaper renewable energy, and litigation against high emitters, investors, banks, pension funds, insurers, and universities are increasingly divesting to reduce climate risk (Grantham Research Institute on Climate Change and the Environment, 2022; International Renewable Energy Agency, 2021; Setzer & Higham, 2022). Most losses on stranded assets will be borne through pensions and savings in wealthy countries, particularly the United Kingdom and the United States (Carrington, 2022; Semieniuk et al., 2022). By contrast, it pays to adapt: failing to invest $30.4 billion this decade to address climate damages as they occur would lead to $376.6 billion in damages and lost growth by 2030 under a 1.5 °C warming scenario (Sanderson & O’Neill, 2020).
Viewed through breached planetary boundaries and quantified losses, channeling money into nature is not philanthropy but prudent risk management and a source of durable returns. Early adopters of the TNFD recommendations and users of World Business Council for Sustainable Development guidance have documented substantial upfront and long-term cost savings from investing in natural systems (TNFD, n.d.-a; World Business Council for Sustainable Development, 2025), whereas opting out of biodiversity reporting may save compliance costs in the short run but raises the cost of capital in the long run (Hickman, n.d.). Scientists have urged policymakers toward a nature-positive future that halts and reverses biodiversity loss (Locke et al., 2026). Achieving it requires recalibrating both how impact is measured and what “impact” means.
1.4 Approach and Structure of the Article
This article is a conceptual desk review. It synthesizes peer-reviewed research; institutional and grey literature from multilateral organizations, financial institutions, and civil society; and selected nature-finance cases, drawing on ecological economics, natural capital accounting, and monitoring, reporting, and verification (MRV) practice. It also draws on the authors’ combined experience of more than 40 years in environmental, development, sustainability, and impact evaluation. Cases were selected purposively to illustrate the gap between reported and actual impact and to exemplify each level of the proposed continuum. They are illustrative rather than a systematic or representative sample, and valuation figures are reported as published by their sources, which use differing methods. The continuum and scoring rubric are therefore offered as a preliminary framework to be tested and refined empirically.
Section 2 explains why current environmental, social, and governance (ESG) and impact accounting are insufficient. Section 3 introduces Return on Environment (RoEn) as a complement to Return on Investment (ROI) and sets out its six dimensions. Section 4 presents the Environmental Impact Continuum and a preliminary RoEn scoring rubric. Section 5 discusses how to finance regeneration transparently, and Section 6 concludes with three recommendations.
-
Why Current ESG and Impact Accounting Are Insufficient
2.1 Impact as a Misnomer
The impact investment market is designed to provide capital to address the world’s most pressing challenges in sectors such as energy, microfinance, healthcare, sustainable agriculture, infrastructure, and housing (Global Impact Investing Network [GIIN], 2025). It overlaps with the ESG framework through which organizations take nature, people, and governance systems into account in their investments (Bergman, Deckelbaum, & Karp, 2020). Intent, however, exceeds implementation: The Open University (2023) found that 77% of organizations believe ESG has a significant impact on their reputation and brand, yet only 8% report a mature and fully implemented ESG strategy. ESG results need to be tracked consistently and treated as a learning exercise, and the meaning of “impact” in ESG metrics and impact investing needs to be professionalized.
Too often, “impact” is used for any level or type of activity or product, rather than higher-order results. In Figure 3, “100 companies supported” and “1.4 trillion committed” are inputs or outputs, the immediate results of activities, rather than lasting change. Such benchmarks sit too early in the results chain and report only on how money was spent.
Figure 3. Impact as a misnomer

Figure 4. Logical framework toward impact

Figure 4 separates what investors can control and manage (inputs, activities, and outputs, on the left) from what makes a difference (outcomes and impact, on the right) for three types of investment. In the forestry example in the bottom row (Lesy Čekanová, n.d.), establishing a conservation area that extends forest life through (bio)diversification is an output under the owner’s control. What matters are the outcomes and impacts: although felling fewer trees reduces immediate income, delayed returns increase as the standing forest provides air and water filtration, soil conservation, and biodiversity to the surrounding village, leading to ecosystem-level impacts such as richer biodiversity, more rainfall, and cooling from forest cover.
2.2 Narrow Benchmarks
Performance indicators often track only inputs, outputs, or activities for compliance purposes and do not adequately price the benefits of ecological regeneration. Even sustainability indicators often treat nature as a free good and center on short-term, human-centric gains. The GIIN Benchmarks, for example, assess an enterprise’s impact performance against the Sustainable Development Goals (SDGs) (GIIN, n.d.). Three of the five 2025 benchmarks (agriculture, forestry, and energy) are broadly environmental (Figure 5), yet only a handful of their key performance indicators (KPIs), marked with orange arrows, target planetary health: the percentage of land protected or restored, land under sustainable management, and greenhouse gas (GHG) emissions avoided or removed. Most of the remaining KPIs concern economic activity or human-centric benefits, or they precede impact-level results.
Figure 5. Global Impact Investing Network (GIIN) benchmarks

2.3 Verification Gaps and Community Ground-Truthing
A further challenge is that much of the data reported by investors is subjective, self-reported, and not independently verified. Given the extent of greenwashing, that is, claiming environmental benefits without verifiable evidence, robust MRV is needed to validate outputs and trace outcomes and impacts (Akepa, 2026; World Rainforest Movement, 2022). Satellite and remote-sensing tools for forest monitoring are advancing rapidly (Figure 6). Verra issues voluntary carbon units for projects that reduce emissions from deforestation and forest degradation (REDD+) against established baselines and verification processes (Verra, 2023), and Arbonics tracks afforestation by combining satellite, remote-sensor, and landowner data (Arbonics, n.d.).
Figure 6. Examples of MRV for REDD+ and forestry

Human verification nonetheless remains essential, and ground-truthing should actively involve local communities rather than external auditors alone. Local actors provide continuous, place-based knowledge of ecosystems: they detect change, validate anomalies in remote data, and identify drivers of degradation that satellites often miss, such as selective logging, governance failures, and shifting land-use practices. Their involvement strengthens accountability, reduces the risk of misreporting and elite capture, and aligns MRV with equity and benefit-sharing. Because those who steward the land become co-producers of the data that underpin climate finance, MRV is transformed from a compliance exercise into locally grounded environmental governance. In Grenada, participatory geographic information systems (PGIS) combined community mapping with geo-referenced data to capture fine-scale insights on vulnerability, hazards, and local priorities and to design locally relevant risk-reduction strategies (Canevari-Luzardo, Bastide, Choutet, & Liverman, 2017). In addition, thousands of trained and experienced national evaluators in every region of the world, such as those in the Valuing Voices network, can verify data transparently and share findings with corporate clients and local communities (Valuing Voices, n.d.).
2.4 Investor Priorities and the Business Case for Nature
These principles of integrated, impact-focused investing with on-the-ground MRV are not yet widely applied. In a survey of investors (Figure 7), investment returns ranked above positive ESG impact and sustainable outcomes, and the priority given to “achieving a positive impact” and contributing to sustainable outcomes was declining (orange arrow), even amid a global polycrisis underpinned by environmental devastation (BNP Paribas Asset Management, BNP Paribas Corporate & Institutional Banking, & Coalition Greenwich, 2025).
Figure 7. Downward trend in investing in sustainable outcomes

Impact capital can reverse this dynamic by treating natural systems as assets rather than externalities. Coastal mangrove restoration in the wider Caribbean, and especially in Mexico, for instance, can deliver a three-to-one return through boosted fisheries, tourism revenue, and avoided cyclone damage (Menéndez, Lowrie, & Beck, 2022). In Rwanda, blended finance has funded smallholder agroforestry that raises farmer incomes while sequestering tens of thousands of tons of carbon, generating credits that multinationals buy to meet net-zero commitments (Rwanda Forestry Authority, n.d.). Long-horizon investors such as Norway’s sovereign wealth fund are directing billions toward biodiversity-friendly agriculture and circular-economy infrastructure, citing lower volatility and improved risk-adjusted returns (Norges Bank Investment Management, n.d.). In the Czech Republic, Refugium buys land to conserve biodiversity and measures changes in its state and ecosystem services, drawing on the global assessment of the Intergovernmental Science-Policy Platform on Biodiversity and Ecosystem Services (IPBES, 2019; Refugium, n.d.).
The economics are straightforward: healthy ecosystems purify water, pollinate crops, absorb carbon, and buffer storms at no charge, and substitutes are unavailable or prohibitively expensive. Investing early in their protection or restoration avoids future liabilities and opens new revenue streams, from regenerative-cotton premiums to blue-carbon offsets. At a regional scale, cities with green stormwater systems attract insurers and lower their borrowing costs, and states that safeguard working forests secure stable timber royalties and recreational tourism. Globally, impact capital accelerates the transition to a $10 trillion low-carbon marketplace that many analysts project will outgrow traditional sectors over the next two decades (Buchner et al., 2023).
3. From Return on Investment to Return on Environment
3.1 Defining Return on Environment
ROI is a financial ratio that measures the profit generated by an investment relative to its cost, that is, the profitability of a human enterprise (Fernando, 2024). In ROI, planetary costs and benefits are ignored or assumed to be neutral and unchanging. RoEn complements ROI by asking what an investment returns to the environment on which all returns ultimately depend. The term has a precedent in public-sector valuation, where it was used to estimate the economic value of protected open space in Southeastern Pennsylvania (Delaware Valley Regional Planning Commission [DVRPC] & GreenSpace Alliance of Southeastern Pennsylvania, 2010); this article extends it to investment analysis and evaluation.
Impact-accounting bodies are moving in this direction. The International Foundation for Valuing Impacts and the Value Balancing Alliance (2023) define impact as a change in one or more dimensions of people’s well-being, either directly or through a change in the condition of the natural environment. RoEn goes a step further by focusing on what makes a difference for ecosystems themselves, on which the well-being of millions of species depends. Patagonia offers a corporate example. Earth is now its only shareholder: the Holdfast Collective owns all non-voting stock (98% of the total) and will use “every dollar received from Patagonia to protect nature and biodiversity, support thriving communities and fight the environmental crisis” (Patagonia, 2022). For Patagonia, the planet is visible in ROI because the company also considers RoEn.
Natural capital, and its preservation, enhancement, or replacement, is central to economic, social, and environmental sustainability (A. C. Smith et al., 2017). Discussing the World Bank’s report Reboot Development: The Economics of a Livable Planet, Damania, Zaveri, Ebadi, and Russ (2025) argue that nature is being pushed beyond its limits and that soil, land, forests, waterways, and oceans must be treated as economic infrastructure if development is to meet sustainability objectives, safeguard livelihoods, generate jobs, and secure a livable planet. The returns can be tangible and substantial: reforestation under China’s Grain for Green Programme produced a measured 58% increase in precipitation in reforested areas and an estimated 74.9 billion cubic meters of additional rainfall per year across the country (Tian et al., 2022; Xie et al., 2024).
3.2 Valuing Ecosystem Services
Ecological economists have long examined how the services the planet provides enter economic theory and practice (Gómez-Baggethun, de Groot, Lomas, & Montes, 2010). Ecosystem services such as clean air and water and stored carbon, which benefit humans and other living beings, can be valued and recorded on balance sheets as assets or as liabilities, the latter increasingly tracked as climate risks rise. As Costanza et al. (2014) show, nature cannot be treated as a free good: ecosystem services contribute more than twice as much to human well-being as global GDP, and the value of thriving natural capital and its ecosystem services must be acknowledged and integrated into measures of well-being (Kubiszewski et al., 2025). Too often, nature’s provisioning is valued only at the point of death, when trees are felled for wood, fish are caught for food, or brush is cleared for agriculture, with little account of the benefits those assets would have provided if retained.
Figure 8 illustrates the four types of ecosystem services: supporting (nutrient cycling, primary production, biodiversity), provisioning (food, timber, genetic diversity), cultural (spiritual and cultural heritage value, recreation, tourism), and regulating (climate regulation and carbon storage, water flow and storm-surge control, erosion control). These functions are not spread evenly across the planet. Peatlands cover about 3% of the Earth’s surface but store about 30% of its soil carbon (Masterson & North, 2025). Similarly, mangroves, seagrasses, and salt marshes together cover about 1% of the ocean floor but store up to 10 times as much carbon per unit area as terrestrial forests; their regulating services make them a vital source of “blue carbon,” the carbon dioxide (CO2) captured by coastal and marine ecosystems, and a priority for investments with a high RoEn (Carbon Credits, 2026).
Figure 8. Ecosystem services

3.3 Dimensions of Return on Environment
Companies increasingly need to evaluate their natural capital dependency, that is, their reliance on ecosystem services such as fresh water, soil quality, and pollination (Ceglar et al., 2024). When these assets are degraded by climate change or pollution, businesses face severe supply-chain and operational risks (Hoang & Vu, 2026). The Natural Capital Measurement Catalogue (2024) provides metrics to help enterprises evaluate the risks of undermining their dependency on natural systems. Building on this work, Table 1 sets out six dimensions of RoEn, with example KPIs that capture results that make a difference to ecosystems. These preliminary dimensions form the basis of the scoring rubric proposed in Section 4.7.
Table 1. Dimensions of Return on Environment and example indicators
| Dimension | Example indicator (KPI) |
| Carbon | CO2 emissions avoided or sequestered |
| Water | Filtration capacity, water retention |
| Biodiversity | Species richness, habitat restoration |
| Resilience | Avoided disaster loss |
| Natural capital | Ecosystem asset appreciation |
| Community | Livelihood stability |
Source: Authors.
Companies already capture value from ecosystem services. A proprietary 2012 study led by Robert Costanza examined wetlands for Disney in Orlando, showing how companies can integrate ecosystem services into their balance sheets and generate value through public-sector financing mechanisms (Creelman & Associates, 2012). Table 2 summarizes how four other companies have accounted for ecosystem services through tax treatment, mitigation banking, and user fees.
Table 2. Examples of four companies’ accounting for ecosystem services

Investing in ecosystem services thus benefits the planet while paying for the natural returns that these companies already receive, and it offers a means of compensating for past harm to those services. Tools such as the Institutional Compass can help companies identify which ecosystem services are tied to their investments and compare before-and-after scenarios on chosen parameters, environmental and otherwise (Friend, 2022). Public bodies have also valued these services in detail: in Southeastern Pennsylvania, local, state, and regional governments estimated that protected open space provides $17 million per year in carbon sequestration and air pollution removal by trees, $37 million per year in natural flood mitigation, and $61 million per year in cost savings from filtering pollutants and supplying fresh water (DVRPC & GreenSpace Alliance of Southeastern Pennsylvania, 2010).
3.4 Nature on the Balance Sheet
Investors scarcely think of wildlife as an asset, let alone an ally. Yet, as ecologist Trisha Atwood observes, “wildlife is more than a victim of climate change” (Utah State University, 2026): fish transport carbon to the deep sea, forest elephants spread the seeds of carbon-dense trees, and grazing bison stimulate plant growth and nutrient recycling, so that animals living in their natural environments contribute to carbon storage and sequestration (Schmitz et al., 2023). Such values need not be confined to public accounts; they can also appear on corporate balance sheets. Table 3 presents a conceptual example organized according to the accounting identity in which assets equal liabilities plus shareholder equity.
Table 3. Nature on a balance sheet: A conceptual example (assets = liabilities + shareholder equity)
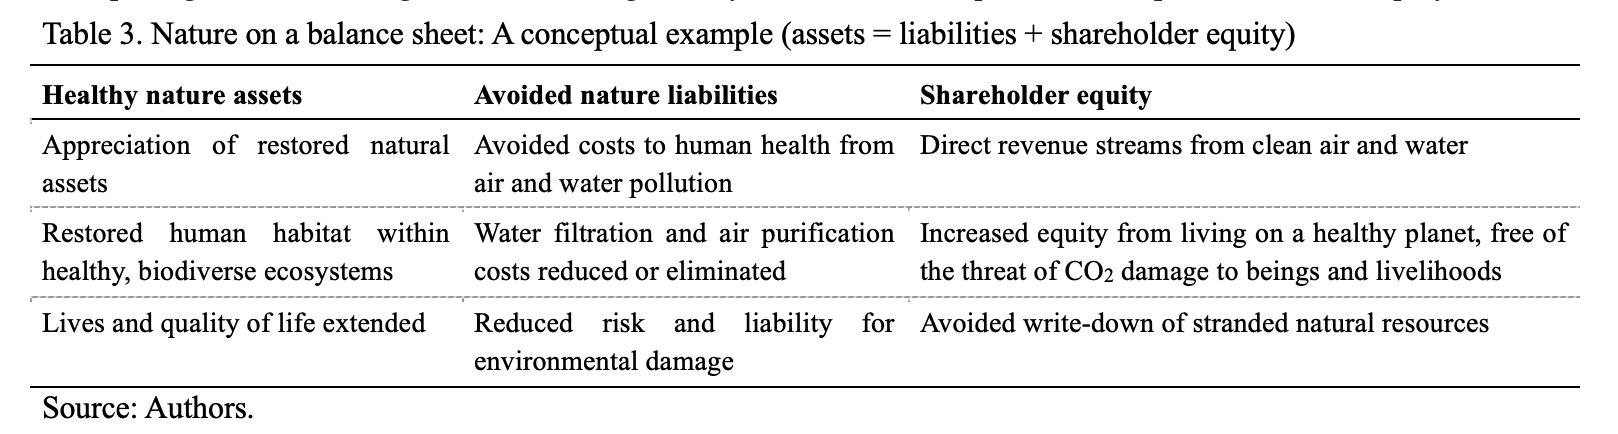
Monetary valuation of ecosystem services is only one input into RoEn. The framework must also capture non-monetized ecological values such as biodiversity integrity, ecosystem resilience, permanence, local stewardship, and intergenerational value. This requires long-duration, resilience-adjusted return instruments through which investments in protective, durable systems yield both financial performance and socio-economic dividends. Such investments absorb systemic shocks, including climate change and infrastructure failure, and deliver stronger long-term risk-adjusted performance than reactive recovery (Antaki, 2026).
Operationalizing RoEn therefore requires an expanded accounting approach. Nature produces public goods and avoided losses that extend beyond immediate cash flows, as when wetlands absorb floodwater. Nature does produce direct revenue in specific, mature sectors such as sustainable forestry and regenerative agriculture, where outputs are private commodities, but the global commons, especially where damaged by human activity, require urgent investment that can be depreciated through balance sheets (Conway, 2026). G. Smith et al. (2026) propose recognizing natural capital liabilities as obligations to restore nature rather than as projected maintenance costs, and they set out Natural Capital Balance Sheets, Natural Capital Income Statements, and Ecosystem Change Statements to track ecological assets, ecosystem service flows, degradation, restoration, and ecosystem condition over time. The Nature Conservancy (2026) documents further measurable gains, including $640 billion in outdoor recreation spending, $7 saved in future disaster costs for every $1 spent on floodplain protection, and air pollution removal worth $3.8 billion a year by urban trees and $6.8 billion by forests overall.
If RoEn is to work, investment portfolios need to be reallocated at scale toward NbS such as regenerative agriculture, ecosystem restoration, water resilience, and biodiversity infrastructure. The next section proposes a typology, the Environmental Impact Continuum, for identifying which investments do so.
-
The Environmental Impact Continuum
4.1 Five Levels of Environmental Impact
Using the Footprint Evaluation typology of impacts on natural systems as a springboard (Davidson, Macfarlan, Rogers, Rowe, & Stevens, 2023), we argue that investors should view their assets and liabilities through five levels of environmental impact, arranged on a continuum from the most destructive, through harmful, to neutral, beneficial, and regenerative (Figure 9). Table 4 defines each level at the ecosystem scale, where impact has the potential to benefit all species through a livable planet.
Table 4. Five levels of the Environmental Impact Continuum

Figure 9. Environmental Impact Continuum

The continuum places every investment in context. It incorporates physical and ecological place and casts a wide net of full-cost accounting for how value is generated. Using this typology, investors can prioritize evidence of where environmental gains are greatest, integrate ecosystem services into balance sheets, and support biodiversity at the genetic, species, functional, and ecosystem levels. Scientific understanding of local ecosystems is therefore a central input to decision-making, not an afterthought. Examining short- and long-term trade-offs, such as yield changes under no-till agriculture and cover crops compared with bare soil and pesticides, and knowing which tipping points or keystone species indicate the state of environmental conditions, will be central to sound investment in a shared future. Sections 4.2 to 4.6 illustrate each level, and Section 4.7 proposes a preliminary rubric for scoring investments against the continuum.
4.2 Destructive
Because profit has been defined narrowly as financial benefit, subsidies for and investment in fossil fuels have continued despite shrinking profit margins, stranded assets, air and water pollution, and climatic instability. Fossil fuel financing by the world’s largest banks reached nearly $8.7 trillion in the ten years after the adoption of the Paris Agreement, including $906 billion in 2025 alone (Banking on Climate Chaos Coalition, 2026). The true costs to the planet are underestimated. Most fossil fuel subsidies are implicit: environmental costs, chiefly from local air pollution and global warming, are not reflected in fuel prices. Total fossil fuel subsidies reached $5.9 trillion in 2020, 92% of them implicit (Parry, Black, & Vernon, 2021). BP, whose 2010 Deepwater Horizon oil spill in the Gulf of Mexico is pictured in Figure 10 (SAFETY4SEA, 2018), exemplifies a retreat from investment in renewables: it plans to expand oil and gas production to 2.4 million barrels a day by 2030 (bp p.l.c., n.d.). Who bears these costs, in monetary terms and beyond, so that the fossil fuel and petrochemical industries can remain profitable?
Fossil fuel investment is the archetype of the destructive level. Beyond driving global warming, climate variability, and extreme weather, petroleum by-products feed plastics and synthetic-fabric production that harm marine and terrestrial wildlife and human health through endocrine disruption, cancer, and other non-communicable diseases. Microplastics and nanoplastics have now reached the soil, air, and water at both poles. The US plastics market is nonetheless projected to grow from $195.37 billion in 2025 to $266.15 billion in 2033 (Research and Markets, 2026). A recent Duke University study conservatively estimates the social and environmental costs of plastics in the United States, including their carbon footprint, litter and pollution, damage to fisheries, landfilling, disease and death, and loss of marine ecosystem services, at $436 billion to $1.109 trillion per year (Lauer, Vegh, Nowlin, Virdin, & Somarelli, 2025).
Figure 10. Destructive: Fossil fuel extraction

4.3 Harmful
Corporations with sustainability goals often aim to do less damage to natural systems. Less harm, however, is still harm. The Triodos Future Generations Fund 2024 impact report (Figure 11) shows the fund outperforming its market index on GHG intensity, fossil fuel involvement, and non-recycled waste (Triodos Investment Management, n.d.), yet these are relatively minimal environmental standards. Such reductions represent transitional, aspirational corporate goals: they reduce damage intensity but leave a portfolio net negative. Rapid action is needed to stem further losses, and polluting less and recycling more is not enough; as circular-economy advocates recognize, waste and pollution cannot be recycled away but must be eliminated at the source (Ellen MacArthur Foundation, n.d.).
Figure 11. Harmful: Reducing damage intensity

4.4 Neutral
Neutral, or “sustainable,” investments still extract resources, but at rates aligned with regrowth or replenishment, so that they neither clearly benefit nor destroy natural systems. Renewable energy can approach this level. Figure 12 shows the generation portfolio of the Czech energy group ČEZ (ČEZ Group, n.d.). None of these sources, however, not even wind, solar, or nuclear power, is beneficial to the planet; at best they approach neutrality, and only when their wider effects are addressed. Technological fixes for energy demand also tend to focus narrowly on carbon and to overlook systemic impacts on biodiversity and habitat. Design improvements, such as darkened turbine blades or bladeless turbines that reduce bird deaths, solar fields interspersed with shade-tolerant crops, and solar arrays placed on existing impermeable surfaces such as roofs and parking lots, are material gains. Nevertheless, competition between farmland and solar farms, and now water- and energy-intensive data centers, reflects a human-centric and short-term logic of profit-making.
Figure 12. Neutral: Renewable energy generation

4.5 Beneficial
Beneficial investments produce measurable net ecological gains by rewilding land, restoring habitat, and planting native flora. In 2026, Illinois became the first US state to recognize rewilding in law as an official conservation tool, partly to counteract the weakened application of the Clean Water Act; the approach includes wetland restoration and may involve reintroducing keystone species such as beavers and bison (Freitag, 2026). Peatlands, wetlands formed by deep accumulations of incompletely decomposed plant material where carbon sequestration exceeds losses through decomposition and water flow (Elsevier, n.d.), are equally vital in Europe, as in the fen systems of the Czech Republic, and, as noted in Section 3.2, hold a disproportionate share of the world’s soil carbon. In a 2025 deal, BNP Paribas’ AXA Investment Managers agreed to finance Pantheon’s inaugural project, the Pocosin Ecological Reserve I, a 14 500-acre peatland site in the southeastern United States (Figure 13). The project aims to turn degraded land into carbon stores that cut emissions, reduce fire hazards, and generate verified carbon credits while supporting climate action and biodiversity under the SDGs (Terzo, 2025).
Figure 13. Beneficial: Peatland restoration

4.6 Regenerative
The highest level of the continuum is investment in regeneration: restoring ecological function, resilience, biodiversity, and community stewardship over time. Living nature provides clean air, filtered water, shade, rain, soil, carbon sequestration, pollination, flood control, and habitat for biodiversity, services integral to human well-being that underpin the economy (Blue Green Future, n.d.). Mangroves illustrate these multiple returns (Figure 14): they regulate climate, serve as fish nurseries, filter water, protect coasts, and provide wood (IUCN, 2018). Above all, regeneration requires an ecocentric, regenerative mindset: a way of being, thinking, and acting that supports regenerative development by fostering the co-evolution of human and natural systems.
Figure 14. Regenerative: Mangrove ecosystems

4.7 Operationalizing Return on Environment: A Preliminary Scoring Rubric
To make RoEn usable in investment practice, we propose, with the assistance of Anthropic’s Claude AI, a preliminary two-part method that can be reported alongside ROI (as defined by Fernando, 2024). First, we prompted the AI to devise a formula that combines the article’s main strands of evidence with the familiar structure of ROI, but replaces financial profit with the ecosystem service values, avoided losses, and ecological damage discussed in Section 3. Its composite score rates each of the six preliminary RoEn dimensions against the five levels of the Environmental Impact Continuum and discounts claimed gains according to the MRV principles set out in Section 2.3. After review and reconsideration, we then asked Claude to suggest how to address two caveats in the use of this formula. The first considered how to facilitate long-term learning and support for community monitoring and decision-making by applying a confidence rating to the evidence used, for example in data poor environments. The second concerned how to include counterfactuals to avoid over- or under-claiming attribution. We then reviewed, modified, and incorporated these revisions.
The first part of RoEn is a monetized benefit-cost ratio for those ecosystem service values that can be credibly monetized:
RoEnm = (VES + LA − DE) / C (1)
where VES is the value of ecosystem service gains attributable to the investment (for example, water filtration, flood mitigation, or carbon sequestration, valued as in Section 3.3), LA is the value of nature-related losses avoided (for example, avoided disaster damage), DE is the cost of ecological damage caused by the investment, and C is the cost of the investment. Attribution requires a counterfactual. Gains and avoided losses should be estimated relative to what would plausibly have happened without the investment, not simply relative to conditions before it began; a forest that was never at risk of clearance, for example, yields no attributable carbon gain from being protected. Where full attribution is not feasible, contribution analysis or comparison sites can provide a defensible estimate. Because valuations are subjective, the ratio should be reported as a range rather than a single figure, and terms for which credible values are unavailable should be omitted (that is, set to zero). The finding that every $1 spent on floodplain protection saves $7 in future disaster costs (The Nature Conservancy, 2026) is, in these terms, a monetized RoEn ratio of 7:1 for a single service. VES and DE are set to zero because the example only reports avoided disaster losses.
Because monetized values capture only part of RoEn, the second part is a composite RoEn score that also covers non-monetized values. Each of the six dimensions in Table 1 is scored against the continuum levels in Table 4, using the criteria in Table 5. Scores are based on evidence at the outcome and impact levels of the results chain (Figure 4) rather than on inputs or outputs, and, as with Equation 1, change is judged against a credible counterfactual.
Table 5. Preliminary Return on Environment scoring rubric
| Score | Level | Evidence criterion (applied to each dimension in Table 1) |
| +2 | Regenerative | Verified restoration of ecological function and resilience over time, with community stewardship |
| +1 | Beneficial | Verified net gain relative to a credible counterfactual (e.g., increased species richness, water retention, or carbon sequestered) |
| 0 | Neutral | Verified no net loss relative to a credible counterfactual |
| −1 | Harmful | Damage intensity reduced relative to past practice or a sector benchmark, but net loss remains |
| −2 | Destructive | Net loss with no credible mitigation, or a contribution to transgressing a planetary boundary |
Source: Authors.
The composite score is calculated as
RoEns = Σ wi vi si, i = 1, …, 6 (2)
where si is the score (−2 to +2) on dimension i; wi is a weight reflecting the ecological materiality of dimension i for the investment and site, with weights summing to 1 (equal weights of 1/6 are used as a default); and vi is a verification factor that applies the MRV principles set out in Section 2.3. The weight of each dimension should be set transparently before scoring, ideally with inputs from scientists and local communities. For example, carbon and water may dominate for peatlands, whereas biodiversity and storm resilience may dominate for mangroves. As indicative values, vi = 1.0 where gains are independently verified and ground-truthed with local communities, 0.5 where they are verified only by a third party or by remote sensing, and 0.25 where they are self-reported. The verification factor applies only to positive scores (vi = 1 when si ≤ 0), so that weak MRV discounts claimed gains but never softens reported harm.
The composite score ranges from −2 to +2 and maps onto the continuum as follows: destructive (below −1.5), harmful (−1.5 to below −0.5), neutral (−0.5 to +0.5), beneficial (above +0.5 to +1.5), and regenerative (above +1.5). One override applies: an investment scored destructive on any dimension cannot be classified above neutral overall, so that gains in one dimension cannot offset boundary transgression in another, which is the weakness of offsetting discussed in Section 5.1.
Three further rules address incomplete evidence and change over time. First, a dimension that cannot be assessed is recorded as “insufficient evidence” rather than scored 0, because absence of evidence of harm is not evidence of no harm. Its weight is redistributed across the assessed dimensions, but if the unassessed dimension is material to the site, the overall rating cannot exceed neutral. Applications of the Footprint Evaluation Typology have likewise left unrated those levels that the available evidence could not support (Rowe et al., 2025). Second, every score is reported with a confidence level (high, medium, or low) reflecting the strength and completeness of the evidence. Third, because regeneration can take decades and ecological gains can be reversed, for example by fire or renewed clearance, investments should be re-scored at regular intervals rather than rated once. The dimension scores are ordered categories rather than precise measurements, so the weighted composite (RoEns) is a convenient summary rather than an exact quantity and should always be reported together with the individual dimension scores (each si).
As a hypothetical illustration, consider a peatland restoration investment such as that described in Section 4.5, assessed with equal weights. If independent, community-verified MRV showed regenerative results for carbon and water (+2 each), beneficial results for biodiversity, resilience, and natural capital (+1 each), and neutral results for community livelihoods (0), the composite score would be (2 + 2 + 1 + 1 + 1 + 0)/6 ≈ 1.17, a beneficial rating. If the same gains were only self-reported, the score would fall to about 0.29, a neutral rating, which shows how verification changes the evaluation. These scores are illustrative only. Reporting ROI, the monetized RoEn ratio, and the composite RoEn score side by side makes visible both what an investment earns and what it returns to, or takes from, the environment. The monetized RoEn (RoEnm) captures how much priced value the investment generates per dollar invested, and the non-monetized composite score (RoEns) captures whether the investment is regenerative or destructive (or in between), and to what extent across all six dimensions, including values that cannot be priced.
- Discussion: Financing Regeneration Transparently
5.1 Financial Instruments for Nature
Institutional investors increasingly regard climate strategy as foundational to fiduciary duty (Lubber, 2025), and central banks, regulators, and international financial institutions also need to integrate climate-related risks and environmental objectives into monetary policy (Krainara, 2026).
One prudent step is for companies to direct corporate social responsibility (CSR) funds toward quick wins, such as peatland conservation or methane reduction, while phasing these assets onto their balance sheets. A growing range of green finance instruments directs capital toward environmentally sustainable projects, including afforestation, reforestation, and revegetation (ARR), REDD+, and improved forest management (IFM) for forests; asset liability management (ALM) for land; and blue finance and blue carbon for water (CFA Institute, 2024). Frontline communities must be prioritized. Indigenous Peoples and forest-dependent communities protect most of the world’s remaining biodiversity yet receive a tiny fraction of global climate finance, and funding should reach them directly rather than through paternalistic financial intermediaries (Forest Peoples Programme, 2025).
Carbon finance and carbon credits are the best-known instruments for nature. A forest’s capacity to absorb CO2 is calculated, and the rights to that absorption are sold on the open market to heavily polluting industries such as oil, shipping, and cement. Such investments still focus on benefiting people through profit, often without reversing past harm: selling credits can license continued pollution on a “pay-to-play” basis rather than funding carbon removal, and it does not deliver the rapid, deep GHG reductions now required. Carbon credits also capture only one dimension of nature. Biodiversity remains deeply underfunded, with a financing gap estimated at $700 billion a year (United Nations Environment Programme Finance Initiative [UNEP FI], 2025). Guidance from the Organisation for Economic Co-operation and Development (OECD, 2026) stresses that financial instruments for biodiversity are effective only when supported by sound policy frameworks, well-functioning markets, and institutions that promote good governance, equity, and coordination.
Marine ecosystems offer another opportunity for regeneration. In 2015, WWF conservatively valued the ocean’s assets at $24 trillion, a value that is declining rapidly (WWF, 2015). Debt instruments now fund marine and water-based projects such as protected areas and pollution reduction, and the Ocean Risk and Resilience Action Alliance (ORRA) and its partners estimate that blue economy investment could create 12 million additional jobs by 2030 and make billions of people more resilient (Builders Vision, Ocean Risk and Resilience Action Alliance, & Katapult Ocean, 2025; Kennedy et al., 2021; ORRA, n.d.; Pouponneau, Bridgland, & Schramm, 2024). Instruments include blue bonds for marine and coastal conservation, tradable blue carbon offsets, and debt-for-nature swaps that restructure or forgive sovereign debt in exchange for conservation commitments. In 2023, Ecuador sealed a landmark deal to protect the Galápagos Islands, replacing older debt with a cheaper-to-service $656 million “Galápagos bond” that matures in 2041 and is insured by the US International Development Finance Corporation; its foreign minister described biodiversity as a valuable “currency” (Jones, 2024a).
5.2 Transparency and Independent Verification
The push for regeneration must be matched by transparency and by independent verification of outcomes. The Galápagos Life Fund, set up to help oversee the Ecuadorian debt swap and co-chaired by the country’s environment ministry, committed to distributing funds fairly and efficiently following meetings with local residents. Yet the Independent Consultation and Investigation Mechanism (MICI) of the Inter-American Development Bank has examined complaints from local groups about a lack of accessible and relevant information and the absence of a strategy for engaging potentially affected communities (Jones, 2024b). Verifying impact-level results is new territory for investors, and growing public scrutiny of false environmental claims is increasing demand for MRV and transparent, verifiable results.
Some institutions are beginning to act, moving ecological regeneration from aspiration toward investable, measurable practice (ABP, 2024; Goldman Sachs, n.d.). Through its asset manager, APG, the Dutch pension fund ABP has invested in large-scale forest assets in the southern United States and New Zealand, including a majority stake in 70 000 hectares of sustainably managed US timberland that is expected to sequester nearly 2 million tons of forest carbon over 15 years, as well as major interests in Taieri Forests Limited and Otago Estate Limited (APG Asset Management, 2025). Goldman Sachs Asset Management has launched one of the first investment-grade fixed-income funds focused on biodiversity conservation and remediation, classified under Article 9 of the EU Sustainable Finance Disclosure Regulation (SFDR), which requires a primary sustainable investment objective, and the fund targets $300 million to $500 million in three to five years (Goldman Sachs Asset Management, 2026).
5.3 Market Momentum and Systemic Change
The market opportunity is significant. The labeled sustainable bond market reached $6.2 trillion in 2025, with more than 60% flowing toward renewable energy and low-carbon transport (World Bank Treasury, 2025). The biodiversity bond market was valued at only $13.2 billion in 2024 but is forecast to reach $61.2 billion by 2033 (Sharma, n.d.). Ecological regeneration is thus increasingly tied to clear mandates, regulated structures, measurable outcomes, and transparent reporting. Reporting actual impact, beyond inputs and outputs, will nonetheless require due diligence in the form of third-party MRV, community-verified biodiversity metrics, and ecosystem-level indicators such as those proposed in Section 4.7.
A shift is also needed from quarterly alpha reporting toward long-duration, resilience-adjusted returns that consider whole economic systems and ecosystems and treat human and natural systems as deeply interconnected and dynamic. A systematic review of ESG applied to territories finds that environmental, social, and governance factors play a growing role in assessments of sovereign risk, institutional quality, and long-term economic sustainability, so that sustainability is becoming a lens through which investors assess entire economic systems rather than only companies (Capoani, 2025).
-
Conclusion and Recommendations
Humanity’s extraction of planetary resources beyond carrying capacity, reflected in seven transgressed planetary boundaries, means that a precondition for any investment is that capital flows to beneficial and regenerative activities, and that investments at lower levels, including renewable energy, should be designed to minimize and offset their remaining harm. This article has argued that current ESG and impact frameworks too often report how money was spent rather than what changed in ecosystems, and it has proposed RoEn, the Environmental Impact Continuum, and a preliminary scoring rubric as means of closing that gap. Three recommendations follow.
First, recognize that humanity has one livable planet, is indivisible from its health, and depends on the planet’s natural systems as the foundation of all forms of profit. Investors and fiduciaries should adopt RoEn alongside ROI in investment analysis and fiduciary standards, deliberately moving away from narrowly applied ROI metrics, and should price natural capital correctly by incorporating ecosystem service valuations into corporate and sovereign accounting.
Second, redefine impact to require measurable, verified, regenerative environmental outcomes rather than merely output delivery and reduced harm. As stewards of the planet, investors should monitor, evaluate, and verify how all investments affect nature and reallocate capital in response to results, while scaling verified instruments such as green bonds, blue bonds, and debt-for-nature swaps with independent MRV and community participation. Tools such as the RoEn rubric proposed here, which require a counterfactual, discount unverified gains, and report confidence levels, can make such verification practical.
Third, shift time horizons from quarterly earnings toward ecocentric, multi-decade ecological and financial return cycles and a global perspective. Pollution and ecological destruction that profit the Global North disproportionately affect the Global South and are decimating biodiversity. Centering equity means ensuring that the communities most exposed to ecological breakdown are co-designers and direct beneficiaries of impact capital.
Nature is economic infrastructure, and the tools needed for large-scale ecological regeneration already exist. Future research should test the continuum and rubric on real portfolios, calibrate their weights, verification factors, and thresholds, and examine how community-verified MRV can be embedded in routine investment reporting.
Acknowledgments
We warmly thank Dennis Bours, Veronika Pesinova-Garcia, Laura Canevari, and Lincoln Bauer for their generous time and feedback on various versions of this article.
Authors’ contributions
Jindra Čekan/ová and Margaret A. Spearman are the authors of the manuscript. Both authors read and approved the final manuscript.
Funding
The authors received no external funding for this work.
Competing interests
The authors declare that they have no known competing financial interests or personal relationships that could have appeared to influence the work reported in this paper. The authors drew on their own prior work and on colleagues’ work, with credit given.
Artificial intelligence disclosure
Generative artificial intelligence (AI; Claude, Anthropic) was used only to assist in revising the final manuscript in response to reviewer feedback, including condensing and copy-editing text, formatting references, and drafting the preliminary RoEn scoring method in Section 4.7, which the authors reviewed, modified, and approved. The authors take full responsibility for the content of this article.
Informed consent
Not applicable.
Ethics approval
The Publication Ethics Committee of the Redfame Publishing. The journal’s policies adhere to the Core Practices established by the Committee on Publication Ethics (COPE).
Provenance and peer review
Not commissioned; externally double-blind peer reviewed.
Data availability statement
All data analyzed in this article are drawn from the published sources listed in the references through October 2026.
Data sharing statement
No additional data are available.
Open access
This is an open-access article distributed under the terms and conditions of the Creative Commons Attribution license (http://creativecommons.org/licenses/by/4.0/).
Copyrights
Copyright for this article is retained by the author(s), with first publication rights granted to the journal.
References
ABP. (2024). Nature and biodiversity policy. Retrieved from
https://www.abp.nl/content/dam/abp/en/documents/dvb/abp-nature-biodiversity-policy.pdf
Africa Center for Strategic Studies. (2024, December 10). Record levels of flooding in Africa compounds stress on fragile countries. Retrieved from
Record Levels of Flooding in Africa Compounds Stress on Fragile Countries
Agarwala, M., Burke, M., Klusak, P., Kraemer, M., Volz, U., & Sovacool, B. K. (2026). Biodiversity loss will decrease the future creditworthiness of nations. Nature Ecology & Evolution. Advance online publication.
https://doi.org/10.1038/s41559-026-03081-7
Agence France-Presse, & Associated Press. (2022, July 13). After the floods: Germany’s Ahr valley then and now – in pictures. The Guardian. Retrieved from
https://www.theguardian.com/world/2022/jul/13/floods-then-and-now-photographs-germany-ahr-valley-flooding-disaster-july-2021
Akepa. (2026, January 12). Greenwashing: 20+ recent stand-out examples. The Sustainable Agency. Retrieved from https://thesustainableagency.com/blog/greenwashing-examples/
Antaki, M. (2026, January 16). From shocks to strength: How resilience drives value creation. World Economic Forum. Retrieved from https://www.weforum.org/stories/economic-growth/resilience-investment-value-creation/
APG Asset Management. (2025, October 2). APG Asset Management acquires majority stake in landmark US forestry asset. Retrieved from
https://assetmanagement.apg.nl/publications/apg-asset-management-acquires-majority-stake-in-landmark-us-forestry-asset/
Arbonics. (n.d.). Understanding Arbonics’ technology. Retrieved from
https://www.arbonics.com/knowledge-hub/understanding-arbonics-technology
Banking on Climate Chaos Coalition. (2026). Banking on climate chaos: Fossil fuel finance report 2026. Retrieved from https://www.bankingonclimatechaos.org/wp-content/uploads/2026/06/BOCC_2026_vFINAL.pdf
Bergman, M. S., Deckelbaum, A. J., & Karp, B. S. (2020, August 1). Introduction to ESG. Harvard Law School Forum on Corporate Governance. https://corpgov.law.harvard.edu/2020/08/01/introduction-to-esg/
Blue Green Future. (n.d.). Blue Green Future. Retrieved from https://bluegreenfuture.org/home/
BNP Paribas Asset Management, BNP Paribas Corporate & Institutional Banking, & Coalition Greenwich. (2025). Main objectives in using thematic investing [Chart]. In Thematics barometer 2025. Retrieved from
https://www.bnpparibas-am.com/en/wp-content/uploads/2025/06/BNPP-Square-Asset-3.jpg
bp p.l.c. (n.d.). Oil and gas. Retrieved from https://www.bp.com/about-us/what-we-do/oil-and-gas
Buchner, B., Naran, B., Padmanabhi, R., Stout, S., Strinati, C., Wignarajah, D., … Marini, N. (2023). Global landscape of climate finance 2023. Climate Policy Initiative. Retrieved from
https://www.climatepolicyinitiative.org/wp-content/uploads/2023/11/Global-Landscape-of-Climate-Finance-2023.pdf
Builders Vision, Ocean Risk and Resilience Action Alliance, & Katapult Ocean. (2025, June 7). Making waves in the regenerative & sustainable ocean economy: Transformative ocean investment opportunities. World Economic Forum. Retrieved from
https://oceanriskalliance.org/wp-content/uploads/Transformative-Ocean-Investment-Opportunities.pdf
Canevari-Luzardo, L., Bastide, J., Choutet, I., & Liverman, D. (2017). Using partial participatory GIS in vulnerability and disaster risk reduction in Grenada. Climate and Development, 9(2), 95-109.
https://doi.org/10.1080/17565529.2015.1067593
Capoani, L. (2025). A systematic review of ESG application to territories. Interdisciplinary Journal of Economics and Business Law, 14(3), 8-37. Retrieved from https://iris.unive.it/handle/10278/5099508
Carbon Credits. (2026, June 19). The importance of blue carbon credits. Retrieved from
https://carboncredits.com/the-importance-of-blue-carbon-credits/
Carrington, D. (2022, May 26). People in US and UK face huge financial hit if fossil fuels lose value, study shows. The Guardian. Retrieved from
https://www.theguardian.com/environment/2022/may/26/people-in-us-and-uk-face-huge-financial-hit-if-fossil-fuels-lose-value-study-shows
Ceglar, A., Parker, M., Pasqua, C., Boldrini, S., Gabet, M., & van der Zwaag, S. (2024, September 24). Economic and financial impacts of nature degradation and biodiversity loss. ECB Economic Bulletin, Issue 6/2024. Retrieved from https://www.ecb.europa.eu/press/economic-bulletin/articles/2024/html/ecb.ebart202406_02~ae87ac450e.en.html
Center for Biological Diversity. (n.d.). The elements of biodiversity. Retrieved from
https://www.biologicaldiversity.org/programs/biodiversity/elements_of_biodiversity/
ČEZ Group. (n.d.). Energy generation. Retrieved from https://www.cez.cz/nextcez/en/energy-generation
CFA Institute. (2024, February 28). How banks and green finance are helping address climate change. Retrieved from https://www.cfainstitute.org/insights/articles/how-banks-and-green-finance-are-helping-address-climate-change
Commonwealth Scientific and Industrial Research Organisation. (2019, September). Agribusiness management, value chain analysis, and leadership: A short course for PCAARRD Industry Strategic Plan managers [PowerPoint slides]. Retrieved from
https://research.csiro.au/inclusivechains/wp-content/uploads/sites/330/2020/07/ISP-Training-full-slide-pack.pdf
Conway, S. (2026, April 13). Nature is not a trillion-dollar asset class – and that’s not the problem. The Risk & Resilience Ledger. Retrieved from https://riskandresilienceledger.substack.com/p/nature-is-not-a-trillion-dollar-asset
Costanza, R., de Groot, R., Sutton, P., van der Ploeg, S., Anderson, S. J., Kubiszewski, I., … Turner, R. K. (2014). Changes in the global value of ecosystem services. Global Environmental Change, 26, 152-158.
https://doi.org/10.1016/j.gloenvcha.2014.04.002
Creelman & Associates. (2012). Accounting for the value of ecosystem services [Unpublished proprietary report prepared for Walt Disney Imagineering].
Damania, R., Zaveri, E., Ebadi, E., & Russ, J. (2025, December 10). The economics of a livable planet: 5 things every policymaker, CEO, and development practitioner should know. World Bank Blogs. https://blogs.worldbank.org/en/climatechange/the-economics-of-a-livable-planet–5-things-every-policymaker–c
Davidson, J., Macfarlan, A., Rogers, P., Rowe, A., & Stevens, K. (2023). Sustainability-inclusive evaluation: Why we need it and how to do it. A Footprint Evaluation guide (Version 1.1). Footprint Evaluation Initiative. Retrieved from https://www.betterevaluation.org/sites/default/files/2023-09/Sustainability-inclusive-evaluation-Why-we-need-it-and-how-to-do-it-Footprint-Evaluation-Initiative-v1-1.pdf
Delaware Valley Regional Planning Commission, & GreenSpace Alliance of Southeastern Pennsylvania. (2010, November). Return on environment: The economic value of protected open space in Southeastern Pennsylvania [Summary report]. Retrieved from https://www.dvrpc.org/reports/11033b.pdf
Ellen MacArthur Foundation. (n.d.). The circular economy: Definition & model explained. Retrieved from
https://www.ellenmacarthurfoundation.org/topics/circular-economy-introduction/overview
Elsevier. (n.d.). Peatland. In ScienceDirect topics. Retrieved July 14, 2026, from
https://www.sciencedirect.com/topics/earth-and-planetary-sciences/peatland
Evans, S. (2021, December 29). Natural disasters in Germany cost insurers €12.5bn in 2021. Artemis. Retrieved from https://www.artemis.bm/news/natural-disasters-in-germany-cost-insurers-e12-5bn-in-2021/
Evans, S. (2026, January 13). 2025 saw $108bn insured disaster losses, costliest year for non-peak perils: Munich Re. Artemis. Retrieved from
2025 saw $108bn insured disaster losses, costliest year for non-peak perils: Munich Re
Fernando, J. (2024, July 30). Return on investment (ROI): How to calculate it and what it means. Investopedia. Retrieved from https://www.investopedia.com/articles/basics/10/guide-to-calculating-roi.asp
Forest Peoples Programme. (2025). Frontline communities and climate finance. Retrieved from https://www.forestpeoples.org/our-work/our-programmes/responsible-finance/climate-and-forest-policy-and-finance/
Freitag, C. (2026, February 5). Illinois becomes first state to recognize ‘rewilding’ wetland protection. Governing. Retrieved from
https://www.governing.com/policy/illinois-becomes-first-state-to-recognize-rewilding-wetland-protection
Friend, M. I. (2022). The institutional compass: Method, use and scope. https://doi.org/10.1007/978-3-031-05453-2
Global Footprint Network. (2025, July 24). Earth Overshoot Day 2025 falls on July 24th: Correcting humanity’s largest market failure [Press release]. Retrieved from
https://overshoot.footprintnetwork.org/newsroom/press-release-2025-english/
Global Impact Investing Network. (2025, January 24). What you need to know about impact investing. Retrieved from https://thegiin.org/publication/post/about-impact-investing/
Global Impact Investing Network. (n.d.). GIIN benchmarks. Retrieved from https://thegiin.org/benchmarks/
Goldman Sachs. (n.d.). Goldman Sachs Biodiversity Bond | GSBDBIE LX | Class I Cap EUR. Retrieved from https://am.gs.com/en-be/advisors/funds/detail/PV107449/LU2972990266/goldman-sachs-biodiversity-bond
Goldman Sachs Asset Management. (2026, May 31). Goldman Sachs Biodiversity Bond [Factsheet]. Retrieved from https://am.gs.com/public-assets/documents/aa4e54f3-1c10-11f0-b638-1305025c09f6?view=true
Gómez-Baggethun, E., de Groot, R. S., Lomas, P. L., & Montes, C. (2010). The history of ecosystem services in economic theory and practice: From early notions to markets and payment schemes. Ecological Economics, 69(6), 1209-1218. https://doi.org/10.1016/j.ecolecon.2009.11.007
Grantham Research Institute on Climate Change and the Environment. (2022, July 27). What are stranded assets? Retrieved from https://www.lse.ac.uk/granthaminstitute/explainers/what-are-stranded-assets/
Hickman, B. (n.d.). Opting out of biodiversity reporting might save compliance costs. It will not protect your cost of capital [LinkedIn article]. Retrieved from
https://www.linkedin.com/pulse/opting-out-biodiversity-reporting-might-save-costs-protect-hickman-biyuc/
Hoang, H. V., & Vu, G. T. M. (2026). Does nature dependence drive firms’ supply chain risk? Economics Letters, 259, Article 112754. https://doi.org/10.1016/j.econlet.2025.112754
Intergovernmental Science-Policy Platform on Biodiversity and Ecosystem Services. (2019). Global assessment report on biodiversity and ecosystem services of the Intergovernmental Science-Policy Platform on Biodiversity and Ecosystem Services (E. S. Brondizio, J. Settele, S. Díaz, & H. T. Ngo, Eds.). Bonn, Germany: IPBES Secretariat. https://doi.org/10.5281/zenodo.3831673
International Foundation for Valuing Impacts, & Value Balancing Alliance. (2023, October). General methodology 1: Conceptual framework for impact accounting [Exposure draft]. Retrieved from https://ifvi.org/wp-content/uploads/2023/10/IFVI_VBA_Public-Exposure-DRAFT_General-Methodology-1_Letter.pdf
International Renewable Energy Agency. (2021). Renewable power generation costs in 2020. Retrieved from https://www.irena.org/publications/2021/Jun/Renewable-Power-Costs-in-2020
International Union for Conservation of Nature. (2018, November 18). New study looks at increasing the success and effectiveness of mangrove conservation investments. Retrieved from
https://iucn.org/news/marine-and-polar/201811/new-study-looks-increasing-success-and-effectiveness-mangrove-conservation-investments
International Union for Conservation of Nature. (2020). IUCN global standard for nature-based solutions: A user-friendly framework for the verification, design and scaling up of NbS (1st ed.). https://doi.org/10.2305/IUCN.CH.2020.08.en
IUCN Red List of Threatened Species. (n.d.). Background & history. Retrieved from
https://www.iucnredlist.org/about/background-history
Jones, M. (2024a, April 23). Exclusive: Ecuador examining new Amazon and ocean linked debt-for-nature swaps. Reuters. Retrieved from
https://www.reuters.com/sustainability/climate-energy/ecuador-examining-new-amazon-ocean-linked-debt-for-nature-swaps-sources-say-2024-04-23/
Jones, M. (2024b, September 27). Record Galapagos debt-for-nature swap scrutinized over transparency irregularities claims. Reuters. Retrieved from
https://www.reuters.com/business/environment/record-galapagos-debt-for-nature-swap-scrutinized-over-transparency-2024-09-27/
Kennedy, E., Xu, D., Mankad, R., Heaps, L., Midgley, A., Holmes, L., & de Liedekerke, V. (2021). Navigating ocean risk: Value at risk in the global blue economy. WWF & Metabolic. Retrieved from
https://value-at-risk.panda.org/assets/file/BlueEconomy_SummaryReport_v06_MSG_compressed.pdf
Khalfan, A., Nilsson Lewis, A., Aguilar, C., Lawson, M., Jayoussi, S., Persson, J., … Acharya, S. (2023). Climate equality: A planet for the 99%. Oxfam International. https://doi.org/10.21201/2023.000001
Krainara, D. (2026, June 28). Green central banking and monetary policy leadership [LinkedIn article]. Retrieved from https://www.linkedin.com/pulse/green-central-banking-monetary-policy-leadership-dr-choen-krainara-lz7uc/
Kubiszewski, I., Costanza, R., Eastoe, J., Lu, T., Mulder, K., Hernandez, G. P., … Dixson-Declève, S. (2025). Building consensus on societal wellbeing: A semantic synthesis of indicators to move beyond GDP. Ecological Indicators, 178, Article 114076. https://doi.org/10.1016/j.ecolind.2025.114076
Lauer, N., Vegh, T., Nowlin, M., Virdin, J., & Somarelli, J. (2025). The social cost of plastic to the United States (NI R 25-09). Durham, NC: Nicholas Institute for Energy, Environment & Sustainability, Duke University. Retrieved from https://nicholasinstitute.duke.edu/publications/social-cost-plastic-united-states
Lesy Čekanová. (n.d.). Homepage. Retrieved from https://www.lesycekanova.cz/en
Locke, H., Rockström, J., Plowright, R. K., Laffoley, D., Little Bear, L., Peres, C. A., … Hauer, F. R. (2026). Nature positive: Halting and reversing biodiversity loss toward restoring Earth system stability. Frontiers in Science, 4, Article 1609998. https://doi.org/10.3389/fsci.2026.1609998
Lubber, M. (2025, May 30). How institutional investors are ramping up climate investments in 2025. Forbes. Retrieved from https://www.forbes.com/sites/mindylubber/2025/05/30/how-institutional-investors-are-ramping-up-climate-investments-in-2025/
Masterson, V., & North, M. (2025, February 21). Peatlands store twice as much carbon as forests – here’s what we can do to save them. World Economic Forum. Retrieved from
https://www.weforum.org/stories/2025/02/peatlands-store-carbon-climate-change/
Menéndez, P., Lowrie, C., & Beck, M. W. (2022). Building mangrove capital: Assessing the benefit cost ratio for mangrove restoration across the wider Caribbean. Arlington, VA: The Nature Conservancy.
National Oceanic and Atmospheric Administration. (2025, September 25). Ocean acidification. Retrieved from https://www.noaa.gov/education/resource-collections/ocean-coasts/ocean-acidification
Natural Capital Measurement Catalogue. (2024, October). User guide. Retrieved from
Norges Bank Investment Management. (n.d.). Nature expectations. Retrieved from
https://www.nbim.no/en/responsible-investment/our-expectations/climate-and-nature/nature/
Ocean Risk and Resilience Action Alliance. (n.d.). The #BackBlue ocean finance commitment. Retrieved from https://oceanriskalliance.org/wp-content/uploads/250509-BackBlue_FINAL.pdf
Organisation for Economic Co-operation and Development. (2026). Mobilising public and private finance for biodiversity: Good practices in unlocking capital for nature. Paris, France: OECD Publishing.
https://doi.org/10.1787/e2b996a1-en
Parry, I., Black, S., & Vernon, N. (2021). Still not getting energy prices right: A global and country update of fossil fuel subsidies (IMF Working Paper No. WP/21/236). Washington, DC: International Monetary Fund. https://doi.org/10.5089/9781513595405.001
Patagonia. (2022). Earth is now our only shareholder. Retrieved from https://www.patagonia.com/ownership/
Potsdam Institute for Climate Impact Research. (2025, September 24). Seven of nine planetary boundaries now breached: Ocean acidification joins the danger zone. Retrieved from
https://www.pik-potsdam.de/en/news/latest-news/seven-of-nine-planetary-boundaries-now-breached-2013-ocean-acidification-joins-the-danger-zone
Pouponneau, A., Bridgland, J., & Schramm, A. (2024, November 21). Riding the blue wave: Unlocking finance for the sustainable blue economy. Global Ocean Accounts Partnership. Retrieved from
https://oceanaccounts.org/insights/2024-11-riding-the-blue-wave-unlocking-finance-for-the-sustainable-blue-economy/
Refugium. (n.d.). Environmentální společnost [Environmental society]. Retrieved from https://refugium.eu/
Research and Markets. (2026, January 14). US plastic market poised to grow from $195.37 billion in 2025 to $266.15 billion by 2033. Yahoo Finance. Retrieved from
https://finance.yahoo.com/news/us-plastic-market-poised-grow-163300082.html
Richardson, K., Steffen, W., Lucht, W., Bendtsen, J., Cornell, S. E., Donges, J. F., … Rockström, J. (2023). Earth beyond six of nine planetary boundaries. Science Advances, 9(37), Article eadh2458. https://doi.org/10.1126/sciadv.adh2458
Ritchie, H. (2021, April 20). Wild mammals have declined by 85% since the rise of humans, but there is a possible future where they flourish. Our World in Data. Retrieved from
https://archive.ourworldindata.org/20251125-173858/wild-mammal-decline.html
Rowe, A., Davidson, E. J., & Chianca, T. K. (2025). The Footprint Evaluation typology guide: Making clear evaluative judgments about environmental sustainability using mixed-method evidence. Bonn, Germany: EvalConnect (DEval) and Footprint Evaluation Initiative. Retrieved from
https://wp.footprintevaluation.org/wp-content/uploads/2026/03/Footprint-evaluation-typology-guide.pdf
Rwanda Forestry Authority. (n.d.). Forest Investment Program: Development of agroforestry for sustainable agriculture in Rwanda. Retrieved from https://www.rfa.rw/1/projects/fip-prodar
SAFETY4SEA. (2018, April 20). Learn from the past: Deepwater Horizon oil spill. Retrieved from
https://safety4sea.com/cm-learn-from-the-past-deepwater-horizon-oil-spill/
Sanderson, B. M., & O’Neill, B. C. (2020). Assessing the costs of historical inaction on climate change. Scientific Reports, 10, Article 9173. https://doi.org/10.1038/s41598-020-66275-4
Schmitz, O. J., Sylvén, M., Atwood, T. B., Bakker, E. S., Berzaghi, F., Brodie, J. F., … Ylänne, H. (2023). Trophic rewilding can expand natural climate solutions. Nature Climate Change, 13(4), 324-333.
https://doi.org/10.1038/s41558-023-01631-6
Semieniuk, G., Holden, P. B., Mercure, J.-F., Salas, P., Pollitt, H., Jobson, K., … Viñuales, J. E. (2022). Stranded fossil-fuel assets translate to major losses for investors in advanced economies. Nature Climate Change, 12, 532-538.
https://doi.org/10.1038/s41558-022-01356-y
Setzer, J., & Higham, C. (2022, June 30). Global trends in climate change litigation: 2022 snapshot. Grantham Research Institute on Climate Change and the Environment. Retrieved from
Sharma, R. (n.d.). Nature-based solutions finance market research report 2033. Growth Market Reports. Retrieved from http://growthmarketreports.com/report/nature-based-solutions-finance-market
Smith, A. C., Harrison, P. A., Pérez Soba, M., Archaux, F., Blicharska, M., Egoh, B. N., … Wyllie de Echeverria, V. (2017). How natural capital delivers ecosystem services: A typology derived from a systematic review. Ecosystem Services, 26, 111–126. https://doi.org/10.1016/j.ecoser.2017.06.006
Smith, G., Horner, C., Ascui, F., Ogilvy, S., Tulsidas, S., & O’Grady, A. P. (2026). Nature on the balance sheet: Accountability for Nature Positive. Methods in Ecology and Evolution, 17(5), 1418-1433.
https://doi.org/10.1111/2041-210X.70193
South Downs National Park Authority. (2018, April). Ecosystem services background paper: South Downs Local Plan [Background paper]. Retrieved from
https://www.southdowns.gov.uk/app/uploads/2018/04/Core-05-Ecosystem-Services-Background-Paper-April-2018.pdf
Stockholm Resilience Centre. (n.d.). Planetary boundaries. Retrieved from
https://www.stockholmresilience.org/research/planetary-boundaries.html
Taskforce on Nature-related Financial Disclosures. (n.d.-a). Example TNFD reporting. Retrieved from
https://tnfd.global/knowledge-hub/example-tnfd-reporting/
Taskforce on Nature-related Financial Disclosures. (n.d.-b). Investing with nature: An introduction to nature-based solutions. Retrieved from
https://tnfd.global/knowledge-bank/investing-with-nature-an-introduction-to-nature-based-solutions/
Terzo, G. (2025, September 23). BNP Paribas’ AXA IM backs nature solutions company to restore US peatlands. Global AgInvesting. Retrieved from
https://globalaginvesting.com/bnp-paribas-axa-im-backs-nature-solutions-company-to-restore-us-peatlands/
The Nature Conservancy. (2026, March 4). Nature’s dividends: The economic, health, and safety benefits of investing in nature. Retrieved from
https://www.nature.org/content/dam/tnc/nature/en/documents/n/a/Natures_Dividends_Economic_Health_Safety_Benefits_Investing_Nature.pdf
The Open University. (2023, November 9). OU report: How businesses can get ahead with ESG. Retrieved from https://university.open.ac.uk/sustainability/news/ou-report-how-businesses-can-get-ahead-esg
Tian, L., Zhang, B., Chen, S., Wang, X., Ma, X., & Pan, B. (2022). Large-scale afforestation enhances precipitation by intensifying the atmospheric water cycle over the Chinese Loess Plateau. Journal of Geophysical Research: Atmospheres, 127(16), Article e2022JD036738. https://doi.org/10.1029/2022JD036738
Triodos Investment Management. (n.d.). Triodos Future Generations Fund impact report 2024. Retrieved from https://www.triodos-im.com/impact-report/2024/triodos-future-generations-fund
United Nations Environment Programme. (2026, January 22). State of finance for nature 2026: Nature in the red: Powering the trillion dollar nature transition economy. Retrieved from
https://www.unep.org/resources/state-finance-nature-2026
United Nations Environment Programme Finance Initiative. (2025, March 3). Governments adopt first global strategy to finance biodiversity: Implications for financial institutions. Retrieved from
https://www.unepfi.org/themes/ecosystems/governments-adopt-first-global-strategy-to-finance-biodiversity-implications-for-financial-institutions/
Utah State University. (2026, June 11). Over 260 global scientists unite on urgent call for wildlife protection for sake of climate. Utah State TODAY. Retrieved from
https://www.usu.edu/today/story/over-260-global-scientists-unite-on-urgent-call-for-wildlife-protection-for-sake-of-climate
Valuing Voices. (n.d.). Team & clients. Retrieved from https://valuingvoices.com/about-us/
Verra. (2023, November 27). Setting the standard: Verra’s revolutionary new REDD methodology. Retrieved from https://verra.org/program-notice/setting-the-standard-verras-revolutionary-new-redd-methodology/
Weizmann USA. (2025, October 27). Humanity rises as wildlife recedes: Two studies show the extent of human domination over nature. Retrieved from
https://www.weizmann-usa.org/news-media/news-releases/humanity-rises-as-wildlife-recedes-two-studies-show-the-extent-of-human-domination-over-nature/
World Bank Treasury. (2025, June). Labeled sustainable bonds: Market update – June 2025 [Newsletter]. Washington, DC: The World Bank. Retrieved from
https://thedocs.worldbank.org/en/doc/c7d5bdd94c82fb169fbdff12d46fe319-0340012025/original/Labeled-Bond-Quarterly-Newsletter-Issue-No-11.pdf
World Business Council for Sustainable Development. (2025, October 10). Embedding sustainability: The key to business resilience. Retrieved from https://www.wbcsd.org/news/embedding-sustainability-the-key-to-business-resilience/
World Economic Forum. (2020). Nature risk rising: Why the crisis engulfing nature matters for business and the economy (New Nature Economy series). Retrieved from
https://www3.weforum.org/docs/WEF_New_Nature_Economy_Report_2020.pdf
World Economic Forum. (2024, December). The cost of inaction: A CEO guide to navigating climate risk. Retrieved from https://reports.weforum.org/docs/WEF_The_Cost_of_Inaction_2024.pdf
World Economic Forum. (2026, June 8). The regenerative blue economy: Pathways to prosperity. Retrieved from https://www.weforum.org/publications/the-regenerative-blue-economy-pathways-to-prosperity/
World Rainforest Movement. (2022, April 28). 15 years of REDD: A mechanism rotten at the core. Retrieved from https://www.wrm.org.uy/sites/default/files/2022-05/REDD_15_%20years_ENG.pdf
World Wide Fund for Nature. (2015, April 23). Ocean wealth valued at US$24 trillion, but sinking fast. Retrieved from https://wwf.panda.org/es/?244970/Ocean-wealth-valued-at-US24-trillion-but-sinking-fast
World Wide Fund for Nature. (2024). Living Planet Report 2024: A system in peril. Retrieved from https://wwflpr.awsassets.panda.org/downloads/2024-living-planet-report-a-system-in-peril.pdf
Xie, D., Zhang, Y., Zhang, M., Tian, Y., Cao, Y., Mei, Y., … Zhong, D. (2024). Hydrological impacts of vegetation cover change in China through terrestrial moisture recycling. Science of the Total Environment, 915, Article 170015. https://doi.org/10.1016/j.scitotenv.2024.170015


 The EU writes, “Ecosystems services offer benefits such as the pollination of crops, clean air, a reduction in extreme weather, human mental and physical well-being, wood for construction, fossil fuels, fresh water, tourism, science, education, recycling, fertilizer, carbon capture, outdoor sports, lakes, flood protection, hydroelectric power, and decomposition of wastes. It’s hard to put a value on every way that rocks, forests, beaches, woods, plants and animals help our lives. But we can put an economic value on the combined benefits of the world’s ecosystems.”


